Station de Ségur-Le-Château
Latitude N 45° 25' 58" Longitude E 01° 19' 00" Elevation 367 m
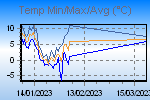
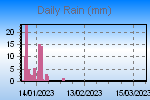
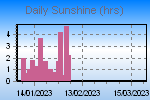
These graphs present the temperature, pressure, rainfall, and wind speed trends for the last 72 hours.
The thumbnail graphs are sampled every ten minutes. Click on a thumbnail to display the corresponding larger graph in the panel above it. The large graphs are sampled every minute.
 |
||||
| Click on a thumbnail to show a large graph in the panel above. | ||||
 |
 |
 |
 |
 |
 |
 |
 |
 |
 |
 |
 |
 |
||
| :now::gauges::today::yesterday::this month::this year::records::monthly records::trends::forum: | ||||
Page updated 23/03/2023 09:53:45
powered by
Cumulus v1.9.4 (10992)